
"One of my charts has a 'Not enough data' message. What does that mean?"
The OurSCHOOL interactive reporting tool provides the option to drill-down results into sub-populations (e.g., by grade, sex, Aboriginal status, home language, etc). In order to ensure survey-taker anonymity, our charts will automatically suppress small drill-down populations from displaying. When a population is restricted, it is accompanied by a ‘**Not enough data’ message within the chart.
For schools under a certain population (e.g., approximately 50 students 4-12), data suppression rules that are intended to protect survey-taker anonymity will likely affect the presentation of their data in the One-click report. We recommend any schools around or below this threshold refer solely to their Interactive Charts.
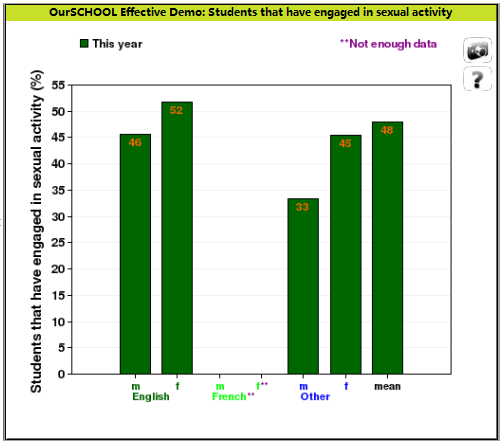
- We will restrict drill-down populations from displaying anytime they are comprised of less than five students.
- Anytime there are only two drill-down populations in a chart and ONE of them has insufficient data, we will restrict BOTH populations from displaying.
- In the district Roll-up Interactive charts, a category can only be drilled-down if it includes data from five or more schools.
"I do not have enough data from each grade to generate a report. Can I gather all the answers into one group to get results?"
When there is not enough data by grade, sex, or any other data variable ventilation, you cannot consolidate these results in a group to generate a report.
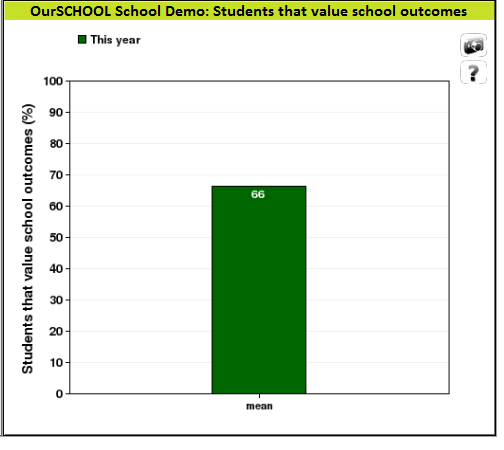
Alternatively, you can use the Interactive Charts in order to have results at the school level. Even if you are not able to go further with the data, you will still have access to a graph that will show you the percentage of responses at the school level, for some questions. Here is an example:
"One of my charts is displaying a hatched result. What does that mean?"
When a survey population reports a unanimous or close to unanimous result, it becomes possible to identify the responses of individual students – particularly when the population is comprised of a small number of students with whom a teacher or administrator is familiar.
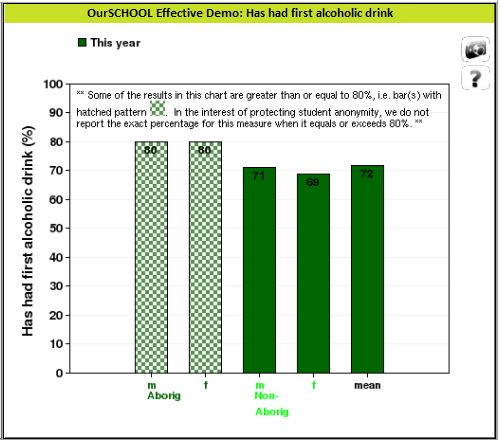
In order to prevent exposing individual student responses, we apply chart hatching to measures with sensitive implications. The measures that are considered sensitive are Risky Behaviours (Tobacco, Alcohol, Other Drugs, Marijuana, and Gambling), Sexual Health, Anxiety, Depression, and BMI – Healthy Weight.
"I see that some of the year levels from my school have been omitted from the Close Survey year list. I know that students from those years completed surveys. Why aren't they appearing?"
The list only shows populations of five or more students. If a year had less than five students complete the survey then it won't appear when the chart results for your school are broken down by year level. However, their answers do get factored into the average values for your school's overall results.
In the interest of protecting the privacy and anonymity of our survey-takers, we don't display the results for any population (i.e., # of students in a year, # of students of a specific sex in a year, demographic category) that includes less than five respondents.